Is Die Hard a Christmas Movie? What Machine Learning Has to Say
Using Azure Machine Learning Studio and Automated ML to settle a classification debate
Introduction
About a month ago my wife and I were spending time together relaxing and I stumbled upon a Reddit post about whether or not the 1988 film Die Hard is a Christmas movie.
This content is also available in video form on YouTube
For those not familiar, there’s been a growing discussion as to whether or not Die Hard should be considered a Christmas movie - largely since it takes place at a Christmas party on Christmas Eve.
This was not a new argument to me, but I realized I didn’t know my wife’s opinion on the matter, so I asked her.
Her response altered the course of my weekend:
“What? No! It’s an action movie! Why would it be a Christmas movie!”
I, being a firm believer that Die Hard is a Christmas Movie, had a response:
“It takes place on Christmas Eve at a Christmas party, it’s about a husband reconciling his relationship with his wife, and it features abundant Christmas theming, including 3 classic Christmas songs.”
Her response was equally valid:
“It’s about a man hunting down terrorists! The movie was released in July, has a body count of 23, and has over 50 F-Bombs!
What’s wrong with you?!?”
While I was convinced of the merits of my arguments, she was equally convinced at the ridiculousness of my point of view.
So who was right?
While we could have agreed to disagree, I had just passed the Azure AI Fundamentals certification and the topics covered on that certification gave me an idea that could resolve this issue once and for all.
My Plan
I decided to get an external opinion that could look at the raw data and make an informed decision without any personal bias or motivation clouding their judgement.
I decided to ask Microsoft Azure what it thought about Die Hard.
Microsoft Azure, for those not familiar, is Microsoft’s cloud computing service. It is similar to Google Cloud or Amazon Web Services or other platforms like it. Not only does it let you host applications and databases in data centers throughout the world, but it also gives you access to some really interesting technologies - including machine learning solutions.
Machine Learning 101
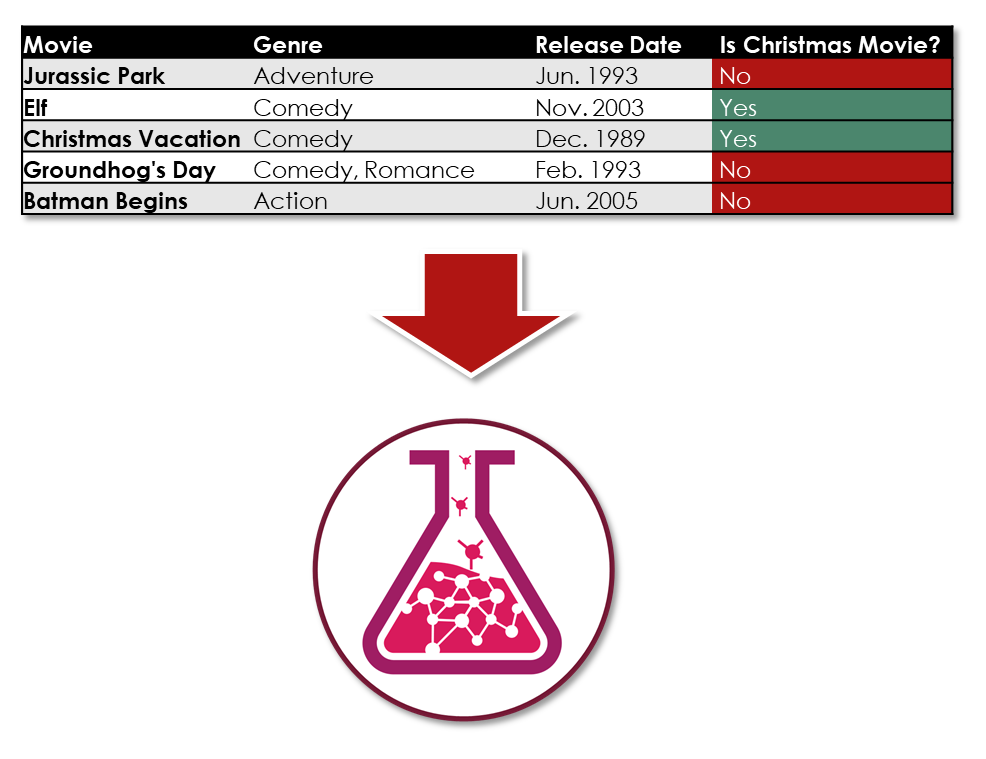
Machine learning is a combination of mathematics and computer science that allows computer algorithms to make certain types of predictions or groupings based on data. There are a number of different flavors of machine learning including regression which predicts numerical values, clustering which sorts data into groups, and classification which determines what type of label to put on something based on its data.
Classification can be used for things like determining if a loan should be approved or rejected, or if a mole is cancerous or benign. However, it could conceivably be used to determine whether or not a movie should be considered a Christmas movie based on historical data from other movies.
Essentially, if I could provide a machine learning training algorithm with historical data on movies that didn’t include Die Hard, but did include both Christmas movies and non-Christmas movies, the machine learning algorithm could potentially identify relationships in the data that caused movies to be considered Christmas movies or non-Christmas movies.
If I was able to do that, then I could feed that trained machine learning model data about Die Hard, which it hadn’t encountered during its training. Effectively, this would let me ask the machine learning model its opinion of Die Hard based only on the relationships in the data it had observed from other movies.
All I needed was a set of data about all types of movies and a list of movies that could be considered Christmas movies.
Christmas Movies
I started by identifying a list of movies that could be agreed upon as Christmas movies.
In order to avoid adding my own bias to my experiment, I used top five lists produced by a internet search result for Christmas movie lists and considered any movie that appeared on at least two of those five lists a Christmas movie.
The top five lists were:
This is a fairly diverse range of sites, but I felt that most of these lists were comprehensive and there was a wide degree of agreement on a core set of Christmas movies.
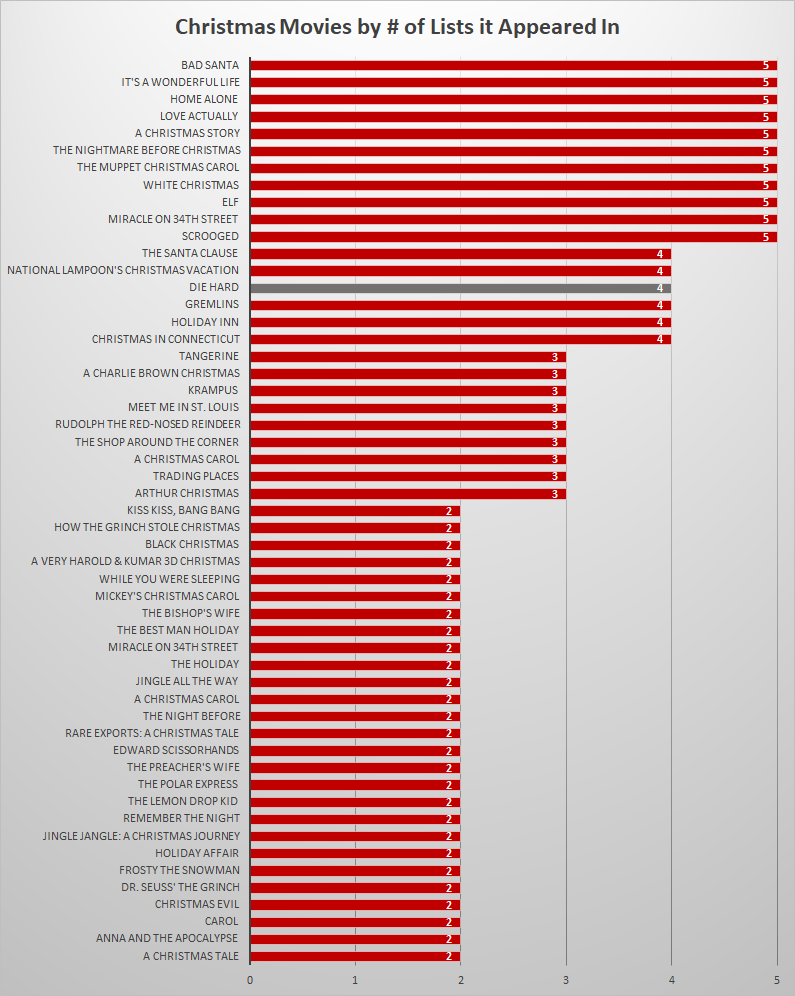
Interestingly, Die Hard appeared on 4 out of 5 of these lists with the 5th list, Thrillist, referencing Die Hard in its second paragraph and stating that it was explicitly excluding it. This put Die Hard at the same level of consideration as a Christmas movie as The Santa Clause and Christmas Vacation and above Rudolph the Red-Nosed Reindeer, How the Grinch Stole Christmas, and several versions of A Christmas Carol.
Note: this doesn’t impact the experiment since the experiment did not encounter Die Hard in its training or validation sets and only encountered it once a trained model was produced. This is just an interesting fact
If you’re curious about the set of movies considered Christmas movies, you can view my spreadsheet or see the chart below:
Getting Movie Data
Now that I had a set of Christmas movies, I needed to find a source of data for movies that might have a sufficient level of detail about the movies for a machine learning algorithm to be able to make inferences as to whether or not a movie is a Christmas movie.
Whenever I’m looking for data for a project I always take a look at Kaggle to see what datasets are out there. Kaggle is a data science community that hosts competitions, tutorials, data sets, and working machine learning projects for the larger data science community. In general, if you’re looking for a dataset, there’s a good chance you can find something relevant on Kaggle.
After a bit of searching, I discovered that Rounak Banik had uploaded a very popular dataset known simply as The Movies Dataset which contained over 45,000 movies along with ratings and keyword information on these movies.
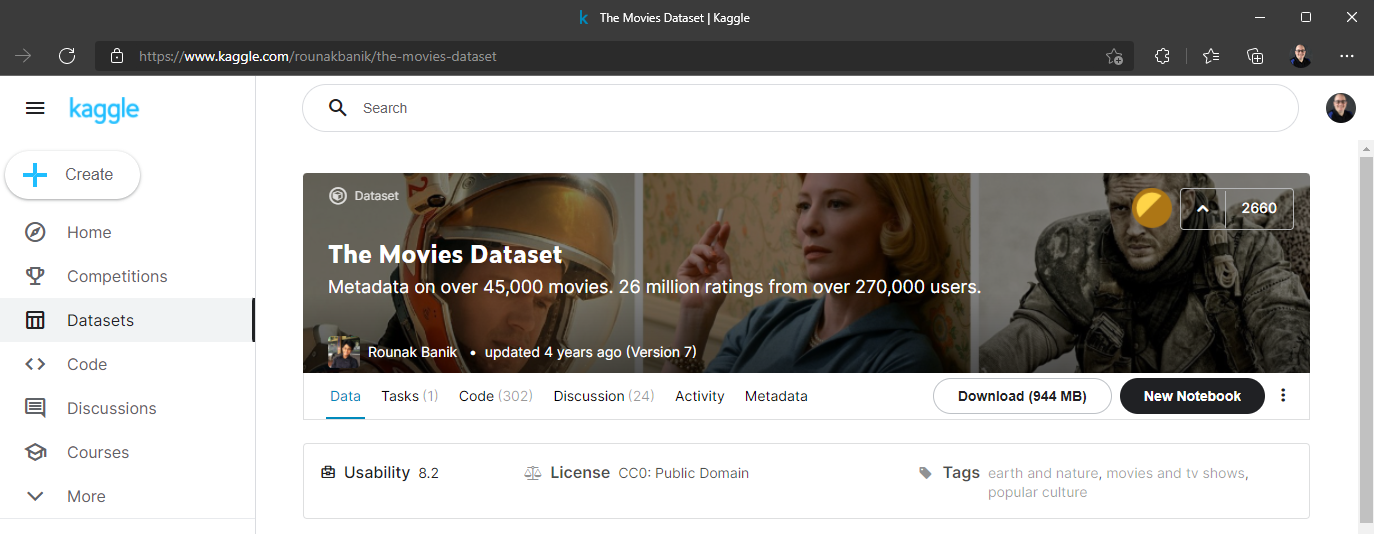
This dataset seemed sufficient for my needs and looked to give a machine learning routine a good chance at finding relationships between the data. Perhaps most importantly, it included every one of my movies that would be flagged as Christmas movies for the algorithm and also contained information on Die Hard.
Exploring the Data
Once I had the data downloaded to my machine I was able to set up a Jupyter notebook project to explore the data using the Python programming language. This lets me load and interact with data from Python code in a very iterative and visual manner.
Exploring data is a more advanced topic to describe for an article about a specific project, but typically involves a mix of data visualization and using descriptive statistics to identify the characteristics of different columns of data. While most of my original exploratory data analysis and statistical analysis work was eventually removed to make way for the final version of the project, some examples are still present in my ProcessedEDA notebook on GitHub.
The goal of this analysis is to determine if your data has bad or missing values or outliers that could be a problem for a machine learning algorithm.
My analysis quickly raised a number of solvable problems:
- Budget and Revenue data was unreliable and was frequently set to 0
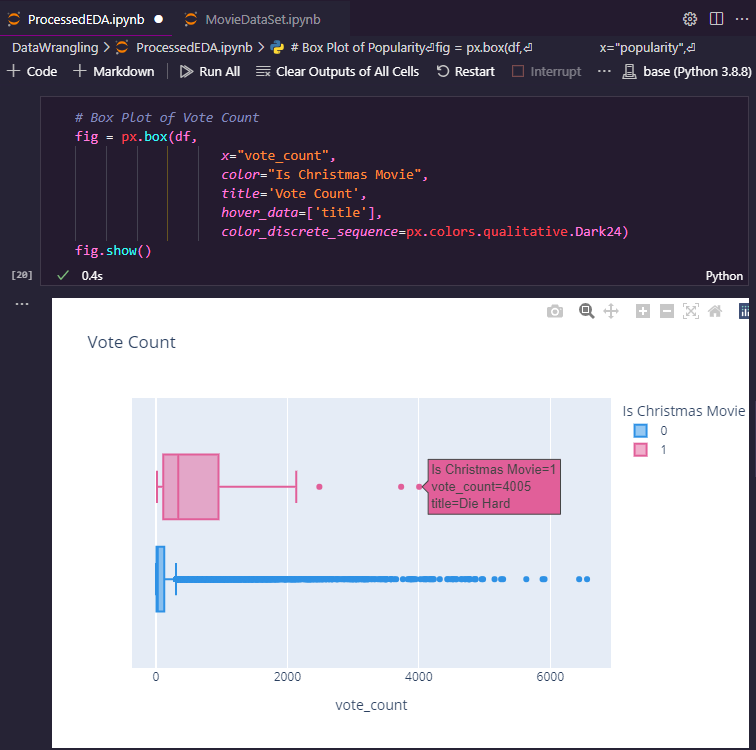
- Vote counts and vote averages were disproportionately distributed among all datasets, with some extremely popular movies such as Avatar receiving far more votes than any other film
- Some movies in the movies dataset came out after a few of the lists I used for identifying Christmas movies
- Some movies occurred far before the earliest movie that was a Christmas movie in the dataset
- The movies dataset included a large number of unreleased movies
Because I was dealing with a dataset with 45,000 movies and only 50 movies flagged as Christmas movies by my process listed earlier, I could afford to throw out outliers. Any movie that was released before the earliest known Christmas movie or after the latest known one was discarded. Any unreleased movie was discarded. Any movie with a greater than 2.5 hour runtime was discarded (some had runtimes that appeared to resemble entire TV seasons). I also dropped a number of unreliable columns including the budget and revenue columns.
Data Wrangling
This process is very normal with data and is often referred to as data cleaning or data wrangling. Data doesn’t typically arrive in the state you want it to be in and you need to adjust for that.
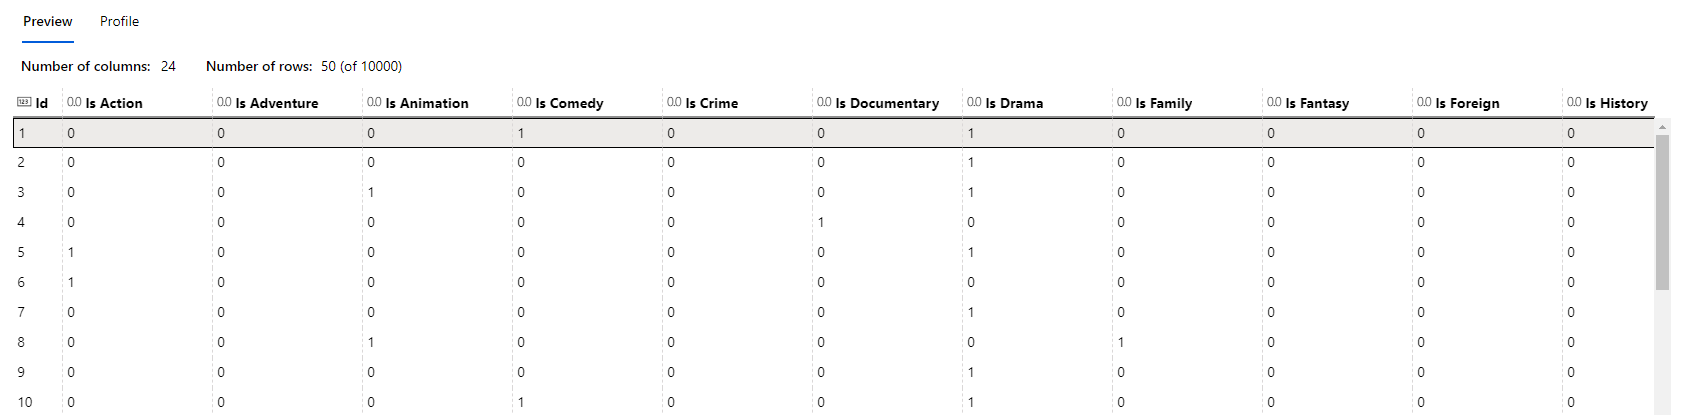
For example, I wanted to have a column for each type of genre and note if a movie was that genre or not with either a 0 or a 1. This would help a machine learning algorithm make distinctions as to what genres something was if that wound up being relevant for classification. However, the movie data I received stored its genre in a column with values that looked like this:
"[{'id': 12, 'name': 'Adventure'}, {'id': 14, 'name': 'Fantasy'}, {'id': 10751, 'name': 'Family'}]"
That meant that I need to write Python code to look at each row in my 45,000 row dataset and translate it from values like this to readable columns like Is Adventure, Is Fantasy, and Is Family with correct values for each movie. Thankfully there are amazing libraries like Pandas that are very good at this, but this is still a typical task a data scientist or data analyst must do when processing data.
I also needed to look at the ISBN of each movie and check it against a list of the 50 ISBNs I had previously identified as Christmas movies via the following code:
# We need to label all rows based on if they're a Christmas movie or not so we can train a model
def set_label(row):
    imdb = row['imdb_id']
    if imdb in labelled_movies:
        row['Is Christmas Movie'] = 1
    else:
        row['Is Christmas Movie'] = 0
    return row

# Run the set_label function on each row, creating the target label column
movies = movies.apply(set_label, axis=1)
Note: The final notebook used to generate the experiment can be found in my GitHub Repository
Once the data was cleaned and prepared I exported it to a comma separated values (CSV) file that I could upload to Azure to run my experiment.
Running Experiments
The full scope of Azure Machine Learning Studio (also called ML Studio) is a topic for another article, but a quick summary is this: ML Studio lets data scientists of all skill and experience levels run machine learning experiments however they feel comfortable.
ML Studio lets you pick one of the following approaches:
- Run your code on your own machine and use Azure to track and visualize results or deploy trained models
- Run your code on Azure’s cloud-hosted resources for faster execution
- Design machine learning routines using a drag-and-drop user interface
- Rely on a “wizard-like” interface called Automated ML that discovers the best machine learning routines to use given your dataset
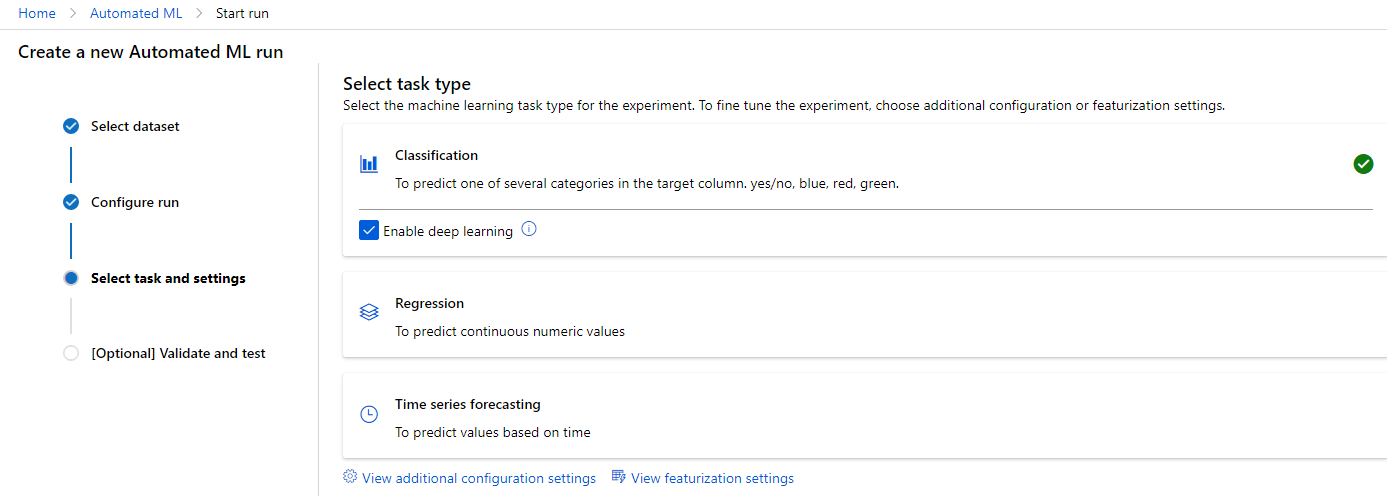
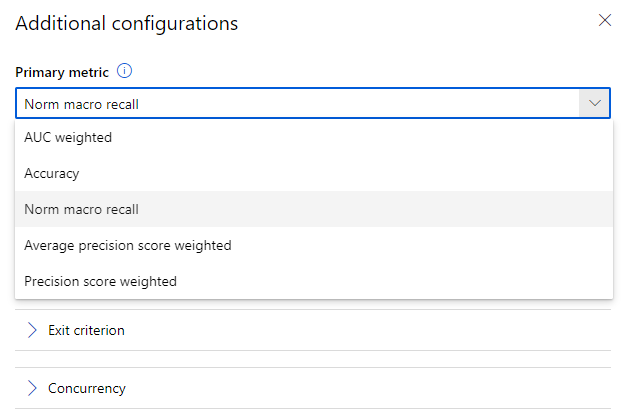
While I’m an experienced software engineer, I’m still new to Data Science so I decided to go with Automated ML where I could tell ML Studio that I wanted to do a classification run on this dataset and have it use the “Is Christmas Movie?” column as the label (the value that should be predicted) given the features (the other columns in the dataset)
I queued up the run on a GPU-based compute resource that cost $ 1.74 per hour of processing time and let it do its thing.
Automated ML took things from there and tried a wide variety of classification routines with various “hyperparameters” for each one. Each time it ran, it evaluated the performance of the trained model against some data it hadn’t seen before. This is done by splitting the data into two groups with one group being used to train the data and the other being used to validate the performance of that data.
Even though splitting data for training and validation is a concept I’m familiar with, I didn’t necessarily need to know that because Automated ML did it for me. In fact, Automated ML ran algorithms I had only barely heard of. All I needed to know was how to structure my experiment in such a way that Azure had a reasonable chance of getting a good result, how to avoid adding bias on accident to my data, and how to interpret the results.
Evaluating Performance
Speaking of the results, after 21 minutes and 23 seconds, Automated ML finished its initial run and presented the results to me:
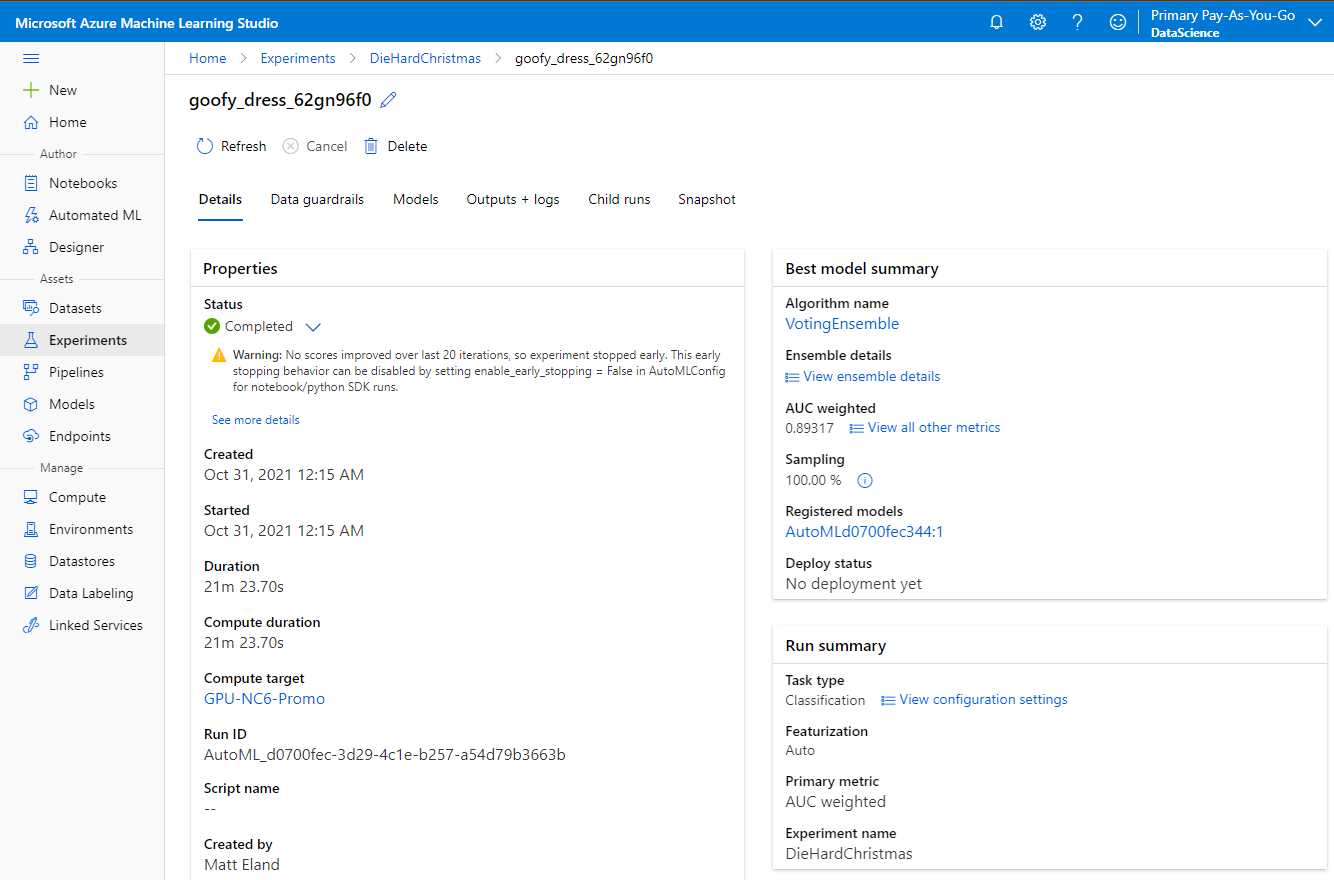
The run details told me that the best performing algorithm for this dataset was an Voting Ensemble - or a combination of other routines that each had their own importance assigned by the routine. Now I as a novice data scientist didn’t need to know anything at all about what that particular routines were used or how they worked, only that this was the best option Azure found for my data on this particular run.
ML Studio also told me that the model’s AUC or area under the curve was 0.89, or 89%, meaning the model was roughly 89% accurate for the data it encountered.
However, performance metrics can be deceiving in machine learning and there are a number of different metrics you need to look at such as recall and precision. Perhaps the best way of visualizing the performance of a classification routine is via a Confusion Matrix which displays a grid of predictions vs actual values.
Here’s the confusion matrix ML Displayed for this initial run:
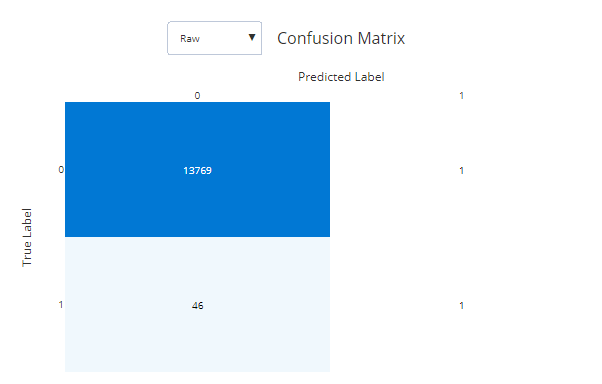
The vertical axis here is what something actually was and the horizontal axis is what my routine said it was. In this case, 13,769 movies were not Christmas movies and my routine said they were not. However, 46 movies were Christmas movies and my routine said they were not.
In short, my routine discovered that if it assumed nearly nothing was a Christmas movie its accuracy would be extremely high because only 0.3 % of the data consisted of Christmas movies.
Clearly this model was not going to be accurate for my needs.
Tweaking Parameters
I decided that while my data was badly skewed, I might be able to get a better result by emphasizing recall instead of overall accuracy.
Recall is a metric that rewards machine learning routines by their ability to correctly place positive cases into the correct location.
This resulted in a more realistic result with 35 out of the 48 movies being correctly classified as Christmas movies, but a large number of non-Christmas movies were falsely classified in the process.
I tried a number of other configurations and got more aggressive in cleaning to reduce the imbalance between Christmas movies and non-Christmas movies, however none of these models performed sufficiently accurately on the validation data.
Adding Keywords
As I went on, I realized that something was bugging me about my experiment. Specifically, I kept asking myself if I could correctly classify movies based on only their genres, runtimes, and release month and years and I realized that I couldn’t. I might be able to guess, but my guesses would be only barely educated.
I realized that if I were having these issues, then it was likely very unfair on my machine learning routine and it might not be able to produce a good result (though machine learning can often find associations where humans cannot).
I decided that I needed to help Azure get more insight into the contents of a movie by incorporating the keywords table from the Kaggle dataset.
I wrote some Python code to merge the keywords data into the movies data and investigated it:
# Load our Keywords dataset
keywords = pd.read_csv(path + "keywords.csv")
keywords['id'] = keywords['id'].astype(int)

# Merge the keywords column into our dataset
movies = pd.merge(movies, keywords, on='id')
This resulted in a new Keywords column being added to the movies dataset with some JSON-like values. Take a look at the following set of tags (with one removed that contained the name of the film) and see if you can guess which movie it came from:
[
    {'id': 911, 'name': 'exotic island'},
    {'id': 1718, 'name': 'dna'},
    {'id': 1719, 'name': 'paleontology'},
    {'id': 1720, 'name': 'tyrannosaurus rex'},
    {'id': 1764, 'name': 'triceratops'},
    {'id': 1765, 'name': 'brontosaurus'},
    {'id': 1767, 'name': 'electric fence'},
    {'id': 2041, 'name': 'island'},
    {'id': 12616, 'name': 'dinosaur'},
    {'id': 155582, 'name': 'amusement park'},
    {'id': 158340, 'name': 'theme park'}
]
Hopefully you were able to discern that these tags came from the original Jurassic Park film from 1993 just from this collection of tags.
Here’s another set of tags for your amusement (again, with a tag containing the name of the movie removed):
[
    {'id': 65, 'name': 'holiday'},
    {'id': 1437, 'name': 'burglar'},
    {'id': 14903, 'name': 'home invasion'},
    {'id': 15075, 'name': 'mischief'},
    {'id': 163841, 'name': 'booby trap'},
    {'id': 169829, 'name': 'suburban chicago'},
    {'id': 169850, 'name': 'mischievous child'},
    {'id': 207317, 'name': 'christmas'},
    {'id': 208349, 'name': 'child'}
]
The above represents the classic movie: Home Alone.
Looking at this data, I saw that I as a human now had enough information to make informed decisions as to what was and was not a Christmas movie just by genres, release dates, and the raw keyword data, but I still needed to get this keyword data into a format that Azure could recognize it.
The Curse of Dimensionality
My initial approach was to parse each movie and add a new column per unique keyword I encountered and set movies to 1 for this column if they had the keyword or 0 if they did not.
However, this resulted in a few problems:
- My data wound up with 14,500 new columns per row, which was very excessive and would greatly slow down training runs
- The size to store the training files on disk exceeded over a gigabyte which introduced new issues for me to deal with on my personal laptop
- Data cleaning was now extremely slow on my laptop and it was hard to make progress on the task
I decided to reduce the columns to only the top 100 keywords or so and this helped significantly from a storage and performance perspective.
However, the training runs didn’t seem to be able to make use of my new columns in coming to any additional accuracy.
As luck would have it, a random LinkedIn connection of mine posted a poll the next day featuring something I’d never heard of called The Curse of Dimensionality. I was curious and looked it up and discovered that this was what was affecting my training results.
Essentially, the curse of dimensionality is when your individual rows are so different from each other that the training algorithm can’t detect the relationship between entities.
Basically, my Christmas movies all had wildly different keywords and too many columns for there to be a good match.
Deep Learning to the Rescue
So I pivoted. I remembered that Automated ML classification runs allowed you to provide text columns and enable deep learning to allow Azure to do determine relationships between text entries.
I have an article discussing deep learning in more detail, but it is essentially a more complex flavor of a neural network that aims to achieve a certain degree of reasoning about data in a way that mimics complex layers of neurons in the brain. At its core, deep learning brings an added degree of complexity to its structure that can be used to detect patterns intelligently.
I got rid of all of my columns for individual keywords and instead translated the array of keywords into a single comma separated string.
For example, Die Hard’s keywords string reads as the following:
helicopter, journalist, based on novel, terrorist, skyscraper, christmas party, s.w.a.t., hostage, kidnapping, vault, fistfight, murder, heist, shootout, los angeles, one man army, explosion, violence, fbi agent, walkie talkie, christmas eve, elevator shaft, one night, action hero
I ran the experiment with deep learning enabled and this simplified keyword column and got a result.
The Trained Model
The final model, codenamed “heroic_wire” by ML Studio’s random naming conventions, took 26 minutes resulted in a recall score of 1.0, or 100% accuracy at predicting that known Christmas movies were actually Christmas movies.
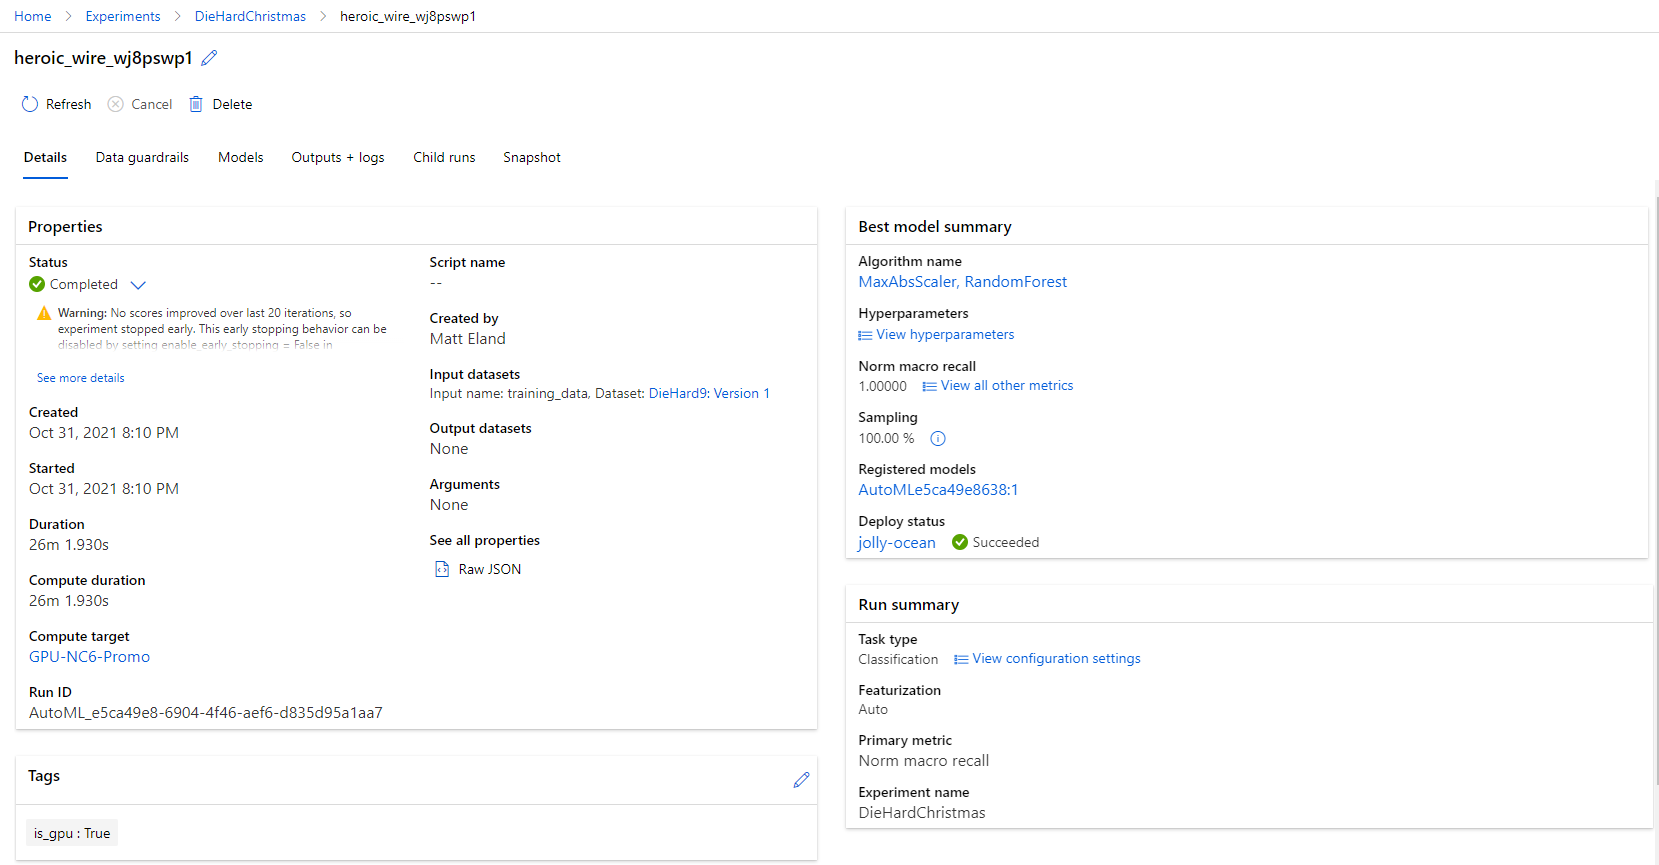
This model used a Random Forest mixed with a Max ABS Scaler to calculate its results (which I only barely understand at this point in my data science journey - again, Automated ML is awesome)
However, one metric isn’t everything, so it’s important to check accuracy and precision as well as recall.
The final confusion matrix looked like this:
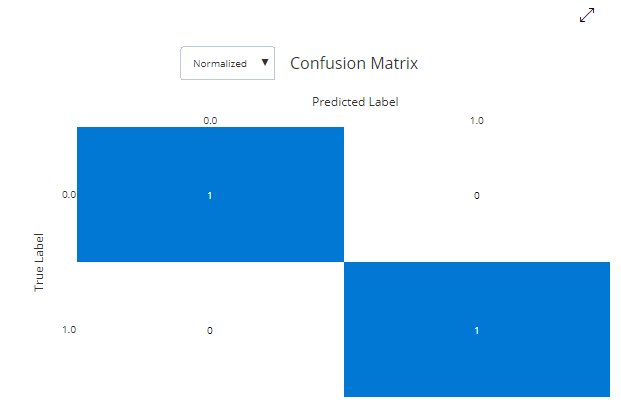
This confusion matrix is displaying the percentages of things instead of the raw count, but it tells a story of perfection: this model correctly classified each movie it encountered as a Christmas movie or a non-Christmas movie with zero mistakes.
Explaining the Model
Believing this to be too good to be true, I drilled into ML Studio’s Explanations feature which attempts to illustrate what aspects of the dataset a model believes is important for classification.
After playing around with a few charts, I stumbled upon this result:
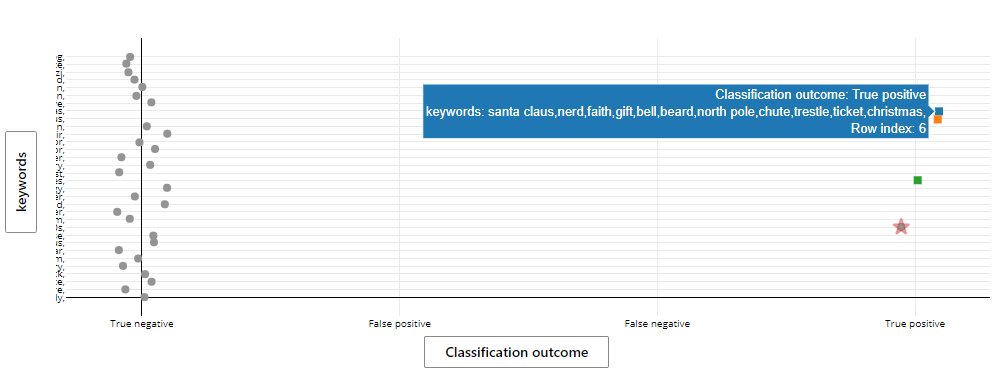
Here Azure found that a number of keywords were very likely to result in a movie being categorized as a Christmas movie while others were maybe less likely to do so or were likely to mark a movie as a non-Christmas movie.
Looking over the results, I saw that most of the keywords seemed to make sense (though I’m not sure why “nerd” appears in the screenshot above) and so I trusted that the Random Tree had made some good associations.
To double check, I charted the impact of the sets of keywords on the probability that something is or is not a Christmas movie and got the following results:
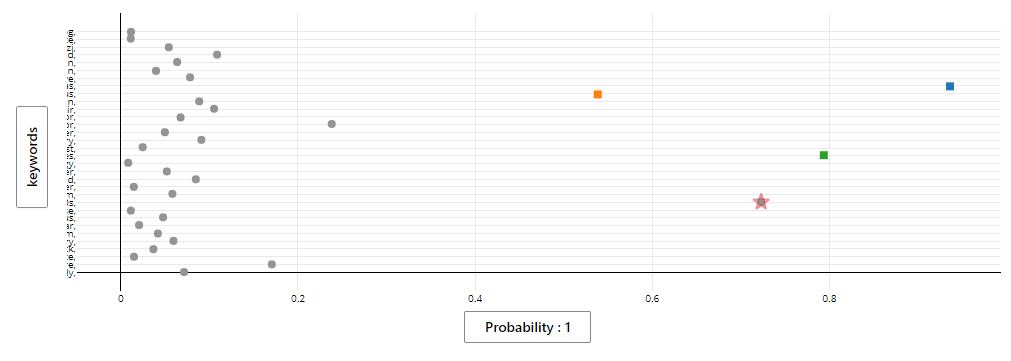
This illustrated that these keywords indeed were confirming that their presence was either a hint of or very strong indicator that a movie was a Christmas movie.
Satisfied that I had a good model, it was time to see what it thought about Die Hard.
Deploying a Model
Once you have a trained model, there are several ways of testing it on new inputs, but the most convenient is to select the model in ML Studio click “deploy”.
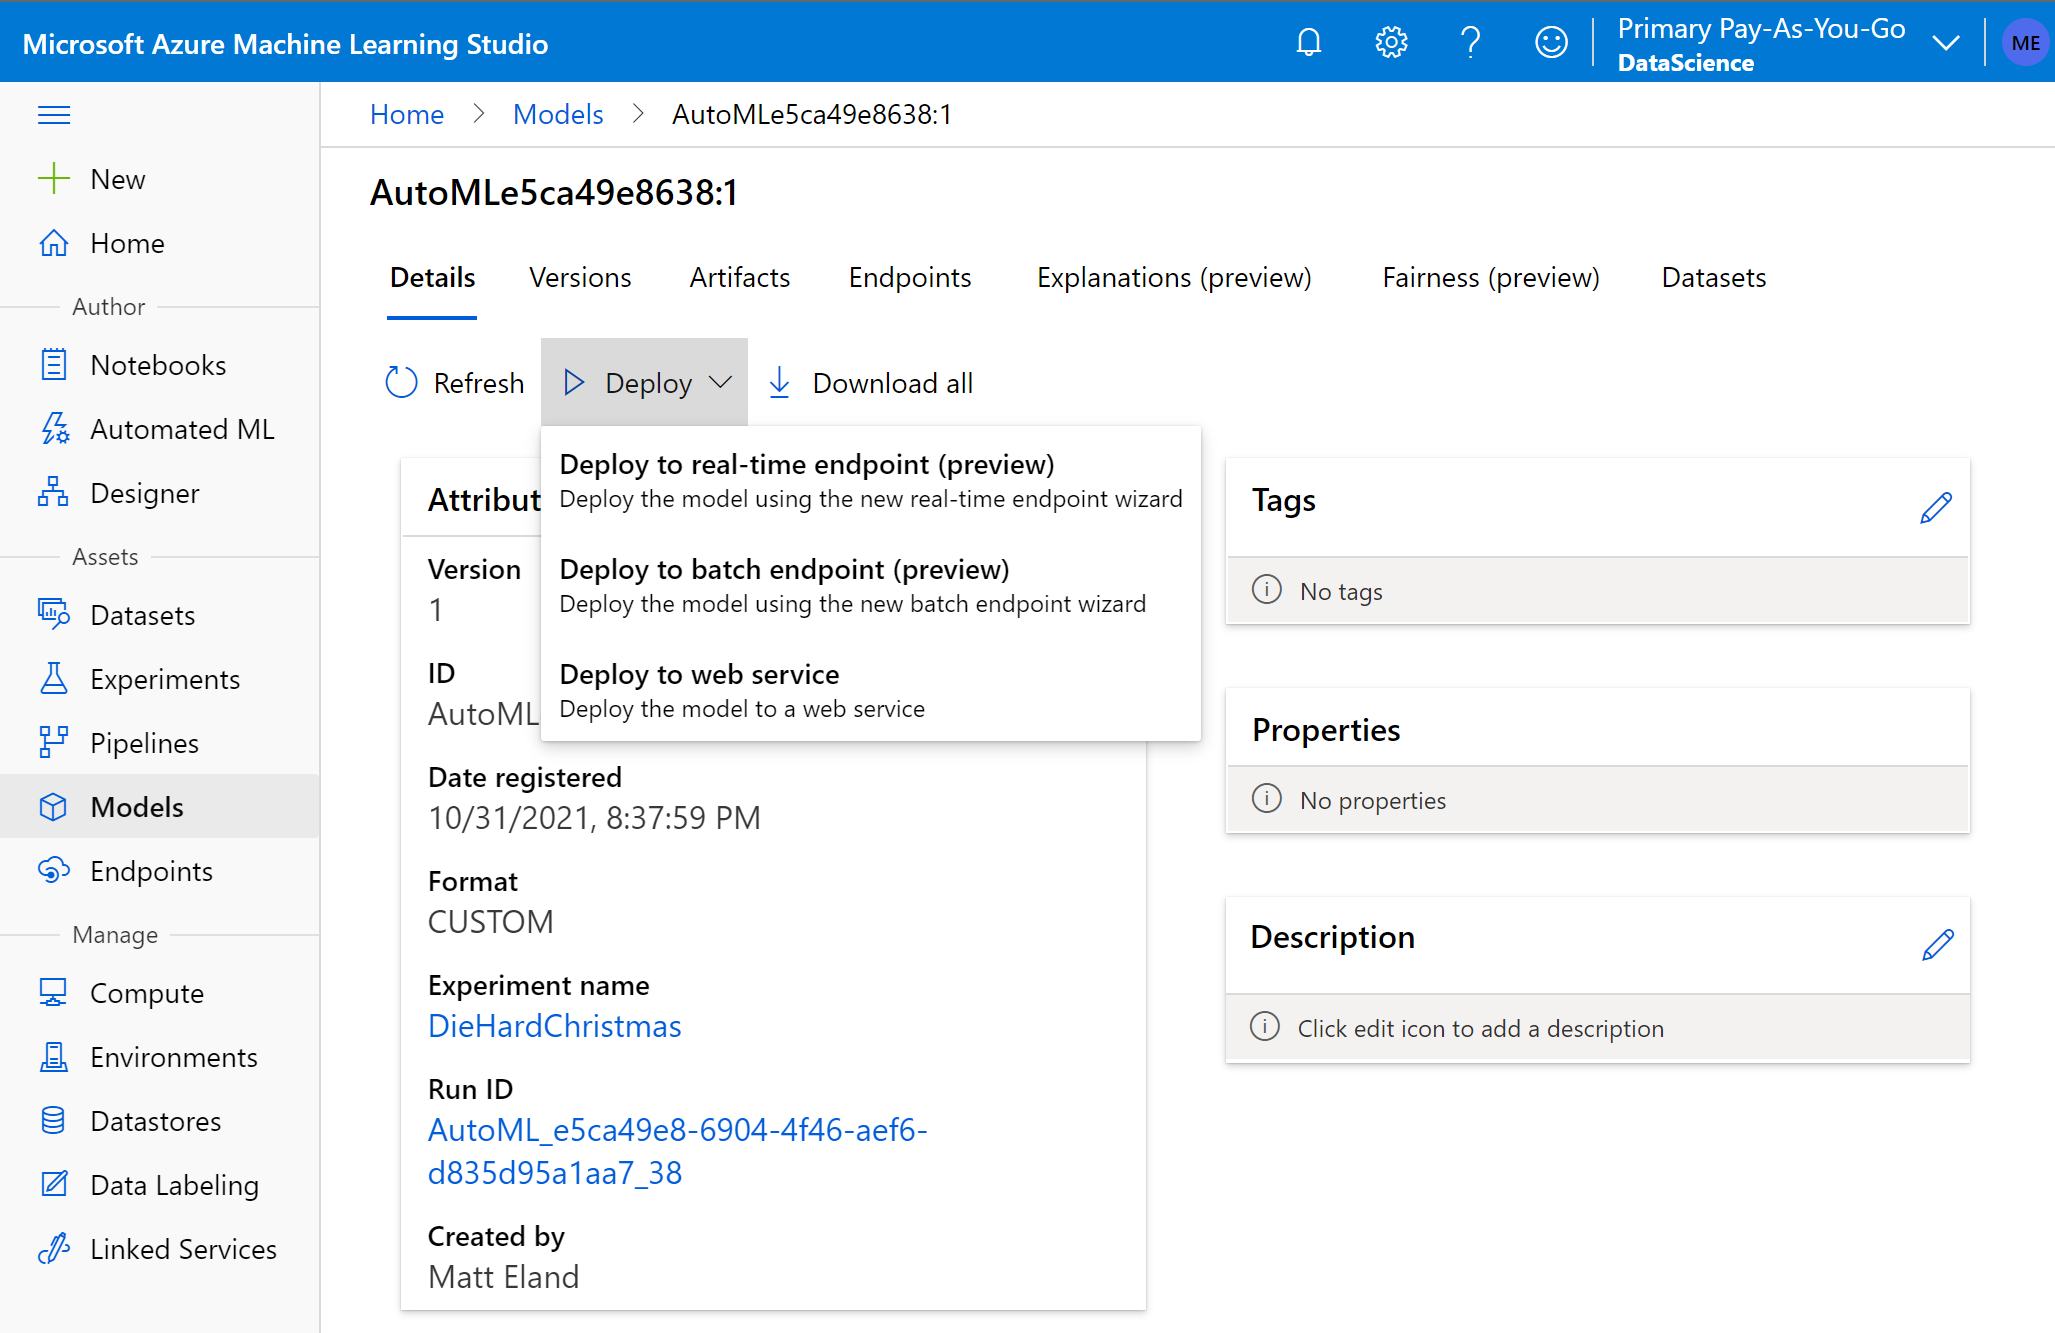
Deploying a model creates a new web service that others can send data to and get a response with some data. You use this with a trained model to generate predictions or classifications based on the data it was originally trained on.
In the context of Die Hard, deploying the trained model will let us send data for a movie the model hasn’t seen before and get a value back indicating if that movie should be classified as a Christmas movie or if it shouldn’t.
I deployed the trained model as an Azure Container Instance capable of evaluating requests in real-time.
Once this was done, everything was in place to get a result to my question: Is Die Hard a Christmas Movie?
So, Is Die Hard a Christmas Movie?
Once you’ve deployed a model ML Studio even gives you a convenient way of testing it using the web user interface. All you need to do is provide some JSON representing the items for the model to evaluate.
I generated JSON for Die Hard from the original dataset, plugged it into the interface, clicked “Test” and got a result:
{
  "result": [ 1 ]
}
All of that work for a 1.
Essentially, what this response means is that the trained model is looking at a set of features - the other columns about the movie Die Hard, and predicting the value of the label - the column we’re trying to predict - for that set of data.
Since the label column I provided to ML Studio was “Is Christmas Movie?”, this 1 means that Azure believes that Die Hard is more a Christmas movie than not a Christmas movie.
Reading between the lines, the trained model appears to have made the association based on the presence of “Christmas” in its keywords section for both “Christmas party” and “Christmas eve”.
I made a few additional requests, but changed the keywords this time. I found that if you removed both the Christmas party and Christmas eve settings from Die Hard, it would not be considered a Christmas movie. However, you’d be substantially changing the film by doing that since the Christmas party was used in part to justify the mostly-empty building and the decorations and trappings of a Christmas party were a recurring theme in the movie.
How Confident is Azure?
Okay, so Azure thinks that Die Hard is a Christmas movie, but how sure was it? The result from the deployed endpoint didn’t give me a probability or confidence level, so it was possible that it was a toss-up for Azure and it was only 55% sure or so.
I had an idea for getting a more granular answer. I decided to ask Azure “how much is Die Hard a Christmas movie?” by running a nearly identical experiment, but running it as a regression analysis instead of a classification run.
Regression is used to predict a numerical value such as a price or a temperature given historical data.
I reasoned that I could predict a numerical value between 0 and 1 with 0 meaning complete confidence the movie was not a Christmas movie and 1 meaning total confidence that the movie is a Christmas movie. This should give me a rough gauge on Azure’s confidence in its assessment.
Running this experiment gave me a final result of 0.9578 and change, or over 95% confidence that yes, Virginia, Die Hard is a Christmas Movie.
Key Takeaways
So, that’s how I spent a very fun weekend at the end of October.
Whether or not you agree with the result or my methodology, I hope you found this writeup educational.
But here’s my main point: If you don’t agree with me or my experiment or its findings, you have what you need to run your own experiment.
Find a dataset you like, document your process, spin up an experiment using Azure Automated ML or something else you like, and share your findings with the community.
If you’re not sure where to start, check out my articles on data science or their accompanying video tutorials. If I don’t have something to help you, there’s a ton of free content on Microsoft Learn on everything from Python to Jupyter notebooks to ML Studio.
To help you out I’m providing a link to the code I used to visualize and prepare the data, and this repository contains the data I used for evaluation.
I hope you can see that data science doesn’t have to be for those who have studied it for years. Pick a project and run some experiments and learn from the process. Take advantage of tools like ML Studio that make machine learning more accessible. Once you’ve got something running, let me know what you built.
Welcome to the party, pal!
I’m still learning myself. If you enjoyed this project, learned something new, or spotted a mistake I made, please let me know so I can grow from it.
Die Hard is a Christmas movie; Change my mind.

A full video walkthrough of this project was posted as part of Festive Tech Calendar on YouTube